How much does a TIPS ladder cost?
The cost depends on how much you need to spend, when spending begins, how long it lasts, and the yields and prices available. The table below isolates two of those: the assumed real yield and the length of the plan.
Ten, twenty and thirty years of spending
Every example targets $40,000 a year in today's dollars, beginning in 2027, with a 2026 model reference year. Each uses a flat real-yield assumption and the site's annual coupon and par-purchase approximation. These are planning estimates, not executable bond quotes.
| Years | Flat real yield | Estimated cost | Missing-maturity rows | Reproduce |
|---|---|---|---|---|
| 10 | 1.00% | $378,852 | 0 | Use this example |
| 10 | 2.00% | $359,303 | 0 | Use this example |
| 10 | 3.00% | $341,208 | 0 | Use this example |
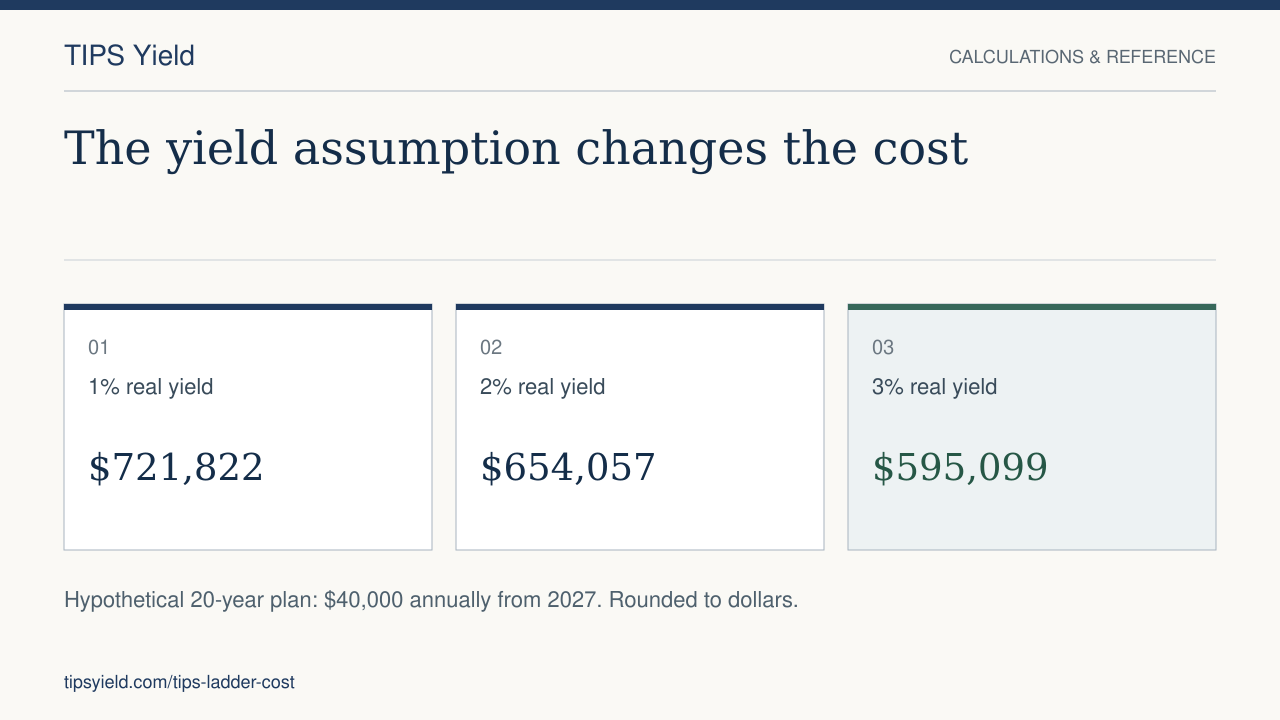
| 20 | 1.00% | $721,822 | 3 | Use this example |
| 20 | 2.00% | $654,057 | 3 | Use this example |
| 20 | 3.00% | $595,099 | 3 | Use this example |
| 30 | 1.00% | $1,032,308 | 3 | Use this example |
| 30 | 2.00% | $895,858 | 3 | Use this example |
| 30 | 3.00% | $784,018 | 3 | Use this example |
Calculated with the published annual par model. Download assumptions and results.
The 20- and 30-year examples include hypothetical costs for the 2037–2039 missing maturities. The price of a real strategy for those years is not locked by the estimate. Read how to handle the gaps.
The formula behind the table
With a flat positive yield and par bonds, the model's answer equals the present value of the spending stream:
Cost = annual income × [1 − (1 + r)−N] ÷ r
Here r is the real yield and N is the number of years. For 20 years at 2%: $40,000 × (1 − 1.02−20) ÷ 0.02 = $654,057. That matches the table to the dollar. Each $1,000 of yearly real spending for 20 years costs about $18,046 at 1%, $16,351 at 2% and $14,877 at 3%.
What zero and negative yields would cost
Real yields have been at or below zero for long stretches. The 10-year real yield closed below zero on about 16% of trading days since 2003, according to this site's yield history. The same formula, applied to zero and negative yields, shows what that does to cost.
| Flat real yield | 10 years | 20 years | 30 years |
|---|---|---|---|
| −1% | $422,909 | $890,532 | $1,407,595 |
| 0% | $400,000 | $800,000 | $1,200,000 |
| 1% | $378,852 | $721,822 | $1,032,308 |
| 2% | $359,303 | $654,057 | $895,858 |
| 3% | $341,208 | $595,099 | $784,018 |
At 0%, the ladder costs exactly the total spending. Below zero, it costs more than it pays out in real terms. The 1% to 3% rows match the model table above. The −1% and 0% rows use plain discounting. The calculator itself sets a minimum coupon of 0.125% and buys at par, so it does not model negative yields this way. See the methodology.
The same plan, priced on different dates
Real yields have moved a lot in five years. The table prices one plan, $40,000 a year from 2027 through 2046, on the real-yield curve of several dates. It uses Treasury's 5-, 10- and 30-year real yields, the calculator's straight-line interpolation between them, and plain discounting of each year's spending.
| Curve date | 5-year | 10-year | 30-year | Estimated cost |
|---|---|---|---|---|
| December 31, 2021 | −1.61% | −1.04% | −0.44% | $888,293 |
| December 30, 2022 | 1.66% | 1.58% | 1.67% | $679,262 |
| December 29, 2023 | 1.72% | 1.72% | 1.90% | $669,632 |
| December 31, 2024 | 2.00% | 2.24% | 2.48% | $638,624 |
| December 31, 2025 | 1.47% | 1.93% | 2.62% | $654,391 |
| October 7, 2026 | 2.66% | 2.92% | 3.36% | $597,264 |
Yields from FRED and Treasury par real yield curves, via this site's yield history. Each year's $40,000 is discounted at the interpolated yield for its distance from 2026. This simplification ignores coupons, actual bond prices and the gap years. Results differ slightly from the calculator, which models coupon bonds.
On the end-2021 curve, the plan would have cost about $888,000. On the October 7, 2026 curve it costs about $597,000. That is roughly a third less for the same real spending. The difference is the gap between a negative and a positive real yield, compounded over twenty years.
The point is not that today's price is a bargain. Yields can rise or fall from here. The point is that ladder cost is very sensitive to real yields. A 1-point change in yield moved the 20-year cost by about $59,000 to $68,000 in the flat-yield table above.
What the table does and does not hold constant
Holding the income target and start year constant shows the yield effect. Higher positive yields reduce the required starting principal, because coupons and reinvestment do more of the work. Changing the start date, cash-flow pattern or curve shape changes the result.
The model does not select CUSIPs, include actual premiums and discounts, account for settlement index ratios or accrued interest, or model your taxes. It also does not credit coupons received before the first target year.
Why the estimate is less than total spending
A ladder uses principal repayments and coupons together. Under a flat 2% assumption, the three-year worked example costs $115,355.33 to provide $120,000 of modeled cash flow. The difference comes from coupons, not from creating principal out of nothing.
Follow the full cash-flow reconciliation. The ladder's principal is used up as planned spending occurs, so the last year is not a promise of a remaining balance.
Try a different spending target
With the same years and positive yields, the model scales in proportion to a level income target. A $20,000 target costs half the corresponding $40,000 target. Taxes, minimum trade sizes and actual quotes make implementation less exact.
For changing annual needs, use the calculator's per-year inputs. A bridge to Social Security or a pension should not be modeled as level spending for thirty years.
Taxes are not in the cost
In a taxable account, TIPS coupons and annual inflation increases in principal are federally taxed each year. The principal increase is not paid until maturity. In a year of high inflation, the tax on it can exceed the coupons you received. That cash has to come from somewhere outside the ladder. Holding the ladder in an IRA or other tax-deferred account avoids the timing problem. See the phantom income example and IRS Publication 1212.
Turn the estimate into a purchase budget
Choose an example using its calculator link, then inspect every assumption. Compare the result with the current maturity inventory and reconcile actual settlement costs. Read the methodology, particularly for low or negative yields.
For a real purchase, use Treasury's published index ratios alongside the bond's quoted price. The cost table above is an original model calculation. It is not a Treasury price quote.
The Ladder Builder workbook is a reusable planning companion. It is a fixed 2026 edition and should be checked alongside current market information.
Frequently asked questions
How much does a 30-year TIPS ladder cost?
For $40,000 a year of real spending starting in 2027, the model gives about $1,032,000 at a flat 1% real yield, $896,000 at 2% and $784,000 at 3%. Actual cost depends on the bonds available and their prices.
How much does $1,000 a year of inflation-protected income cost?
For 20 years, about $18,046 at a 1% real yield, $16,351 at 2% and $14,877 at 3%. For 30 years, about $25,808, $22,396 and $19,600.
Why did TIPS ladders cost so much more in 2021?
Real yields were negative. On the December 31, 2021 curve, the same 20-year plan would have cost about $888,000, compared with about $597,000 on the October 7, 2026 curve.
Does the cost include taxes?
No. In a taxable account you also need cash for federal tax on coupons and annual inflation adjustments. State and local income tax does not apply to Treasury interest.
Can I build a ladder for less than the table shows?
The model scales with spending, so half the income costs half as much. A shorter ladder or a later start also costs less. Higher real yields lower the cost, but you cannot choose the yield on the day you buy.