TIPS vs Treasury bonds
Nominal Treasuries specify dollar payments. TIPS adjust principal for an inflation index. The decision begins with whether you want a fixed dollar amount or a payment that responds to changes in purchasing power.
The difference in one table
| Feature | Nominal Treasury note or bond | TIPS |
|---|---|---|
| Principal at maturity | Fixed face amount | Inflation-adjusted principal, or original face if that is higher |
| Coupons | Same dollar amount every six months | Fixed rate applied to adjusted principal, so the dollar amount changes |
| Quoted yield | Nominal yield | Real yield, before inflation |
| Federal tax | Coupons taxed when paid | Coupons taxed when paid, plus annual principal increases taxed as original issue discount |
| State and local tax | Exempt | Exempt |
| Wins when | Inflation comes in below the breakeven rate | Inflation comes in above the breakeven rate |
Tax treatment: IRS Publication 550 and Publication 1212. TIPS terms: TreasuryDirect.
What breakeven inflation tells you
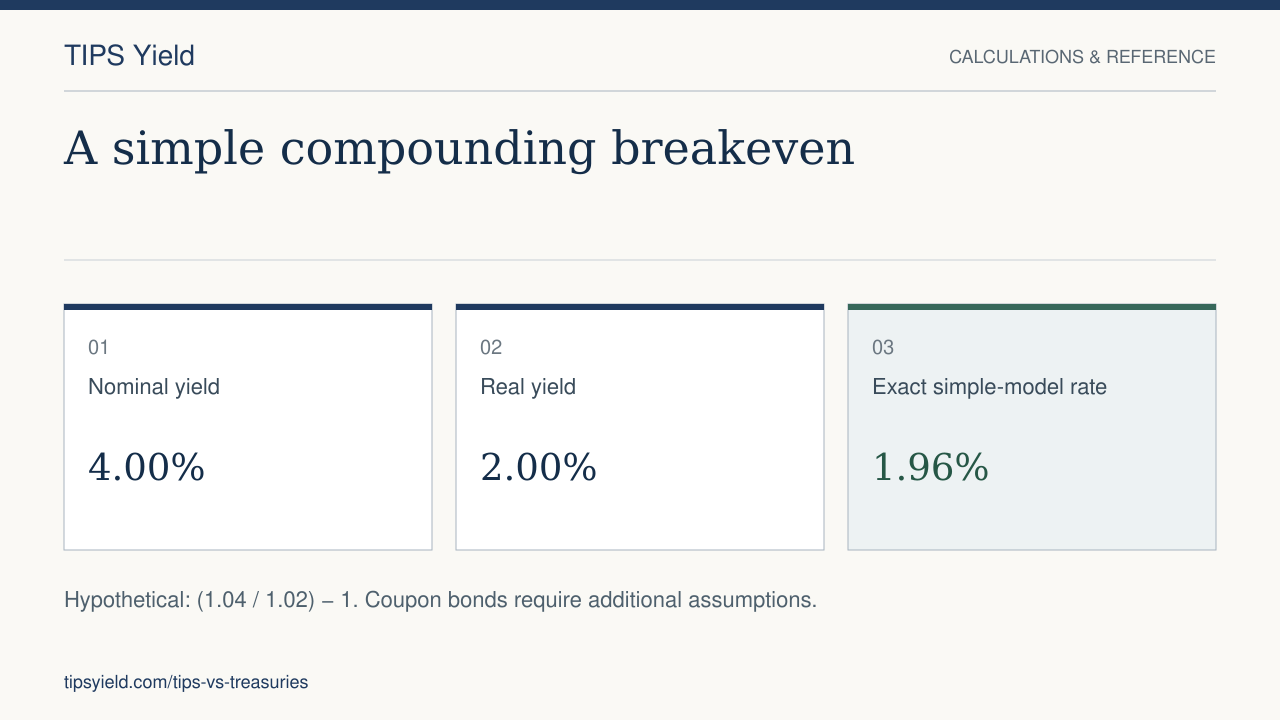
The commonly quoted breakeven spread subtracts a TIPS real yield from a nominal Treasury yield at a comparable term. A nominal 4% yield and a real 2% yield give an approximate spread of 2 percentage points. If inflation averages more than that over the term, the TIPS comes out ahead. If it averages less, the nominal bond does.
Breakeven is useful market information, but it is not a pure inflation forecast. Inflation risk compensation, liquidity and other pricing effects are in the spread. The Cleveland Fed's inflation-expectations research separates expected inflation from risk components with a broader model.
How breakevens compared with actual inflation
The 10-year breakeven at the end of each year can be checked against the CPI-U inflation that actually followed over the next ten years. The table uses this site's daily yield history and the Bureau of Labor Statistics CPI-U series.
| Year-end | 10-year real yield | 10-year breakeven | Actual CPI-U inflation, next 10 years | Actual minus breakeven |
|---|---|---|---|---|
| 2003 | 2.00% | 2.27% | 2.37% | +0.10 |
| 2004 | 1.68% | 2.56% | 2.12% | −0.44 |
| 2005 | 2.06% | 2.33% | 1.86% | −0.47 |
| 2006 | 2.41% | 2.30% | 1.81% | −0.49 |
| 2007 | 1.73% | 2.31% | 1.61% | −0.70 |
| 2008 | 2.14% | 0.11% | 1.80% | +1.69 |
| 2009 | 1.48% | 2.37% | 1.75% | −0.62 |
| 2010 | 1.00% | 2.30% | 1.74% | −0.56 |
| 2011 | −0.07% | 1.96% | 2.14% | +0.18 |
| 2012 | −0.67% | 2.45% | 2.60% | +0.15 |
| 2013 | 0.80% | 2.24% | 2.79% | +0.55 |
| 2014 | 0.49% | 1.68% | 3.00% | +1.32 |
| 2015 | 0.73% | 1.54% | 3.20% | +1.66 |
Yields on the last trading day of the year: FRED DFII10 and T10YIE. Inflation: annualized change in non-seasonally adjusted CPI-U from December of the year shown to December ten years later, from the BLS. Differences are in percentage points.
In 7 of these 13 periods, inflation beat the breakeven, which favored TIPS. In the other 6, it fell short, which favored nominal bonds. The misses were mostly under three-quarters of a point, but two were large. At the end of 2008, in the financial crisis, the breakeven was 0.11%. Inflation over the next ten years averaged 1.80%. At the end of 2015 the breakeven was 1.54%. The decade that followed included 2021 and 2022, and inflation averaged 3.20%.
This is a rough comparison. It uses constant-maturity yields rather than specific bonds, and it ignores coupon reinvestment, the CPI lag and taxes. It shows how far breakevens can miss. It does not show a pattern to trade on.
A simplified compounding comparison
Imagine investing $10,000 for ten years at a constant 4% nominal return, versus a constant 2% real return plus inflation. Assume annual compounding and identical reinvestment. Ignore taxes, fees, coupon timing, the CPI lag and the TIPS deflation floor.
| Assumed annual inflation | Nominal strategy: ending dollars | Real strategy: ending dollars |
|---|---|---|
| 1% | $14,802 | $13,465 |
| 2% | $14,802 | $14,859 |
| 3% | $14,802 | $16,382 |
These values use $10,000 × 1.04¹⁰ and $10,000 × (1.02 × (1 + inflation))¹⁰. They are mathematical scenarios, not quotes or forecasts for actual bonds.
Under this convention, the exact matching inflation rate is 1.04 / 1.02 − 1 = 1.9608%. That differs slightly from the 2-point subtraction. Actual breakevens involve real instruments with their own conventions, so neither shortcut is a complete trade comparison.
The 2021 case
At the end of 2021, the 10-year real yield was −1.04% and the 10-year breakeven was 2.56%. A nominal 10-year bond was pricing about 2.56% a year of inflation. CPI-U then rose 6.45% in 2022 alone. From December 2021 to August 2026 it rose from 278.802 to 334.980, about 4.0% a year.
That is well above the 2.56% breakeven so far, which favors the TIPS buyer over that stretch. The ten-year comparison will not be settled until 2031. The TIPS buyer also accepted a negative real yield. Above-breakeven inflation made the TIPS the better of the two choices. It did not make it a high real return.
Match the bond to the bill
A fixed dollar obligation, such as a mortgage payoff or a known tuition invoice, can be matched with nominal cash flows. A spending target that should rise with prices, such as retirement living costs, can be matched with TIPS cash flows. If you sell either bond before maturity, changes in yields affect the proceeds.
Compare similar maturities and actual settlement prices. A ten-year real yield and a shorter nominal bond do not carry the same timing risk. Many investors hold both, using nominal bonds for fixed bills and TIPS for spending that tracks prices.
Taxes and personal inflation
Use after-tax cash flows where taxes affect the plan. Both bonds are exempt from state and local income tax. A taxable TIPS holding also creates federal tax on principal increases before that principal is paid. In a high-inflation year, that tax can exceed the coupon. A nominal bond has no such mismatch. See the phantom income example.
Your household's inflation rate may differ from CPI-U. A payment indexed to the official measure will not track every expense exactly.
Apply the comparison
The yield history page shows the current real yield and breakeven, with downloadable data. The calculator page includes a nominal-versus-TIPS comparison with assumptions you can change. For retirement spending, start with the ladder walkthrough. What are TIPS covers the mechanics behind the inflation adjustment.
Frequently asked questions
Are TIPS better than regular Treasuries?
Neither is better in general. TIPS come out ahead when inflation over the bond's life is above the breakeven rate at purchase. Nominal Treasuries come out ahead when it is below. In the 13 ten-year periods starting 2003 through 2015, each side won about half the time.
What is a good breakeven inflation rate?
There is no correct level. Compare the breakeven with your own view of future inflation and with the risk you most want to avoid. A buyer who mainly fears high inflation may accept TIPS even when the breakeven looks high.
Do TIPS pay less interest than Treasuries?
The quoted TIPS yield is lower because it excludes inflation. The inflation adjustment to principal makes up the difference. The total return depends on actual inflation.
Are TIPS and nominal Treasuries taxed the same way?
Both are taxed federally and exempt from state and local income tax. TIPS add one difference: annual increases in principal are federally taxable each year as original issue discount, before you receive them.
Which is safer, TIPS or Treasuries?
Both are backed by the U.S. government. They carry different risks. A nominal bond's purchasing power falls with unexpected inflation. Both bonds' market prices fall when yields rise.