Browse the reference library
The 5-year TIPS yield, every trading day since 2003
Reference yield observed . Source: Treasury / FRED. See chart for historical observation dates.
The 5-year real par yield is a Treasury reference rate for inflation-protected bonds at that maturity. It is not an executable quote for a particular bond. Compare observation dates before using it in a plan.
Loading interactive history. Recent observations are available below.
Using the 5-year yield in a ladder
The five-year reference helps describe shorter real cash flows. Bonds maturing sooner than five years can still be bought in the secondary market; five years is an original issue term, not a minimum holding period. The calculator uses the five-year anchor for its early rows, a simplifying assumption explained in the methodology.
New five-year TIPS are normally issued in April and October, with reopenings in June and December. Use the auction calendar and maturity inventory to distinguish an issue term from an actual income date.
Sources, dates and calculation method
The interactive service uses saved FRED history and appends Treasury par yield observations when available. It attempts a refresh at most once every six hours. Markets, publication lags and source outages can leave the last observation unchanged. The dated table below is included in the page even when the chart service is unavailable.
The percentile is the share of available daily real-yield observations strictly below the latest observation, rounded to a whole percent. It describes this dataset; it does not predict future yields or returns. Missing trading days are not filled with invented values.
Source series: FRED DFII5, DFII10, DFII30 and T10YIE; newer observations use Treasury real and nominal par curves. Values are annual percentage rates, not percentage-point changes or total returns.
What the recent history shows
Across 34 available matched dates from 2026-08-03 through 2026-09-18, the 5-year real par yield ranged from 2.04% to 2.55%. It moved from 2.17% to 2.55%, a change of +38 basis points. This is a summary of the downloaded observation window, not a statement about the full historical record.
A basis point is 0.01 percentage point. A higher yield means a lower price for the same promised real cash flows, all else equal. The par-curve series describes a reference maturity, so these observations do not measure the price change or total return of a specific bond or fund.
A price-sensitivity example
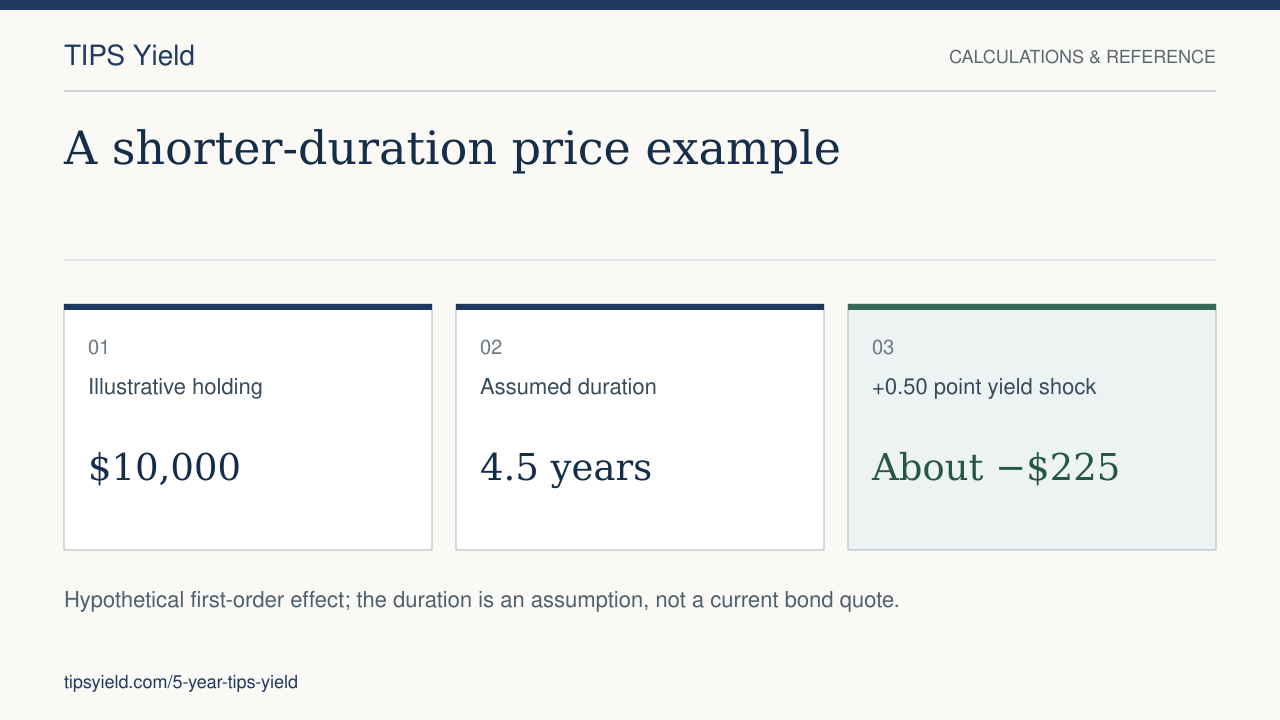
Consider a hypothetical $10,000 holding with duration 4.5 years. A 0.50 percentage-point rise in real yields would imply an approximate price decrease of $225, using price change ≈ −duration × yield change × value. A comparable yield decline gives an approximate increase. The 4.5-year duration is an assumption for this example, not an observed duration for today's 5-year bond.
A shorter horizon usually reduces sensitivity relative to a much longer-duration holding, but it does not eliminate market-price risk. Someone funding spending before a five-year bond matures may still need another maturity or cash. This first-order estimate excludes convexity, coupons, inflation accrual, fees and taxes. See the early-sale explanation.
Common questions about 5-year TIPS
Is the chart yield the coupon I receive?
No. The Treasury par curve is a reference yield; an existing bond has its own fixed coupon and market price. Price, index ratio and accrued interest determine the amount paid at settlement.
Must I hold the bond for 5 years?
You can sell before maturity through a broker, but the sale price is uncertain. 5 years is an original issue term. A bond bought later in its life has less time remaining. TreasuryDirect holdings require a transfer to a bank, broker or dealer before a market sale.
Does the yield protect my exact household budget?
TIPS principal follows the Treasury's specified CPI measure. Your own expenses, taxes and payment dates can differ from that measure. Match the cash-flow schedule to the spending plan and keep the model's exclusions in view.
Why do today's values sometimes remain unchanged?
These are published daily observations, not streaming executable quotes. Weekends, holidays, publication delays and source failures can leave the last available observation unchanged. The date beside the value identifies the observation, even when you visit the page later.
The range and basis-point change above are calculated from the downloadable Treasury observations. Bond mechanics: TreasuryDirect TIPS terms and selling before maturity.
Recent Treasury observations
Saved observations through . The interactive history may contain newer observations.
| Date | 5y real | 10y real | 30y real | 10y nominal | 10y breakeven |
|---|---|---|---|---|---|
| 2026-09-18 | 2.55% | 2.68% | 3.09% | 5.01% | 2.33% |
| 2026-09-17 | 2.46% | 2.61% | 3.04% | 4.94% | 2.33% |
| 2026-09-16 | 2.51% | 2.68% | 3.09% | 5.01% | 2.33% |
| 2026-09-15 | 2.42% | 2.62% | 3.07% | 5.00% | 2.38% |
| 2026-09-14 | 2.40% | 2.60% | 3.05% | 4.97% | 2.37% |
| 2026-09-11 | 2.38% | 2.60% | 3.07% | 4.96% | 2.36% |
| 2026-09-10 | 2.29% | 2.55% | 3.05% | 4.95% | 2.40% |
| 2026-09-09 | 2.20% | 2.46% | 2.98% | 4.83% | 2.37% |
| 2026-09-08 | 2.17% | 2.43% | 2.96% | 4.80% | 2.37% |
| 2026-09-04 | 2.17% | 2.43% | 2.96% | 4.78% | 2.35% |
Source: U.S. Treasury par yield curves. Breakeven = nominal minus real on the same date. Download recent CSV · Download available full history. Historical coverage depends on the saved history service.
THE PRACTICAL NEXT STEP
What comes with the TIPS guide?
Buying walkthroughs, tax examples, and a formulas-visible workbook for planning your ladder.
62-page PDF + Excel workbook · One-time purchase