SCHP versus VTIP
SCHP covers the broad U.S. TIPS market; VTIP focuses on TIPS with less than five years remaining. The main decision is duration exposure. Their published expense ratios in the sources reviewed here are both 0.03%.
Side by side
| Measure | SCHP | VTIP |
|---|---|---|
| Exposure | Broad maturity spectrum | Less than five years remaining |
| Expense ratio | 0.03% | 0.03% |
| Reported duration | 6.4 years, August 31, 2026 | 2.3 years, June 30, 2026 |
| Principal on a personal spending date | Requires selling shares at market value | Requires selling shares at market value |
Sources: Schwab SCHP and Vanguard VTIP factsheet, checked September 11, 2026. Duration dates differ; holdings and duration change over time.
What the duration difference means
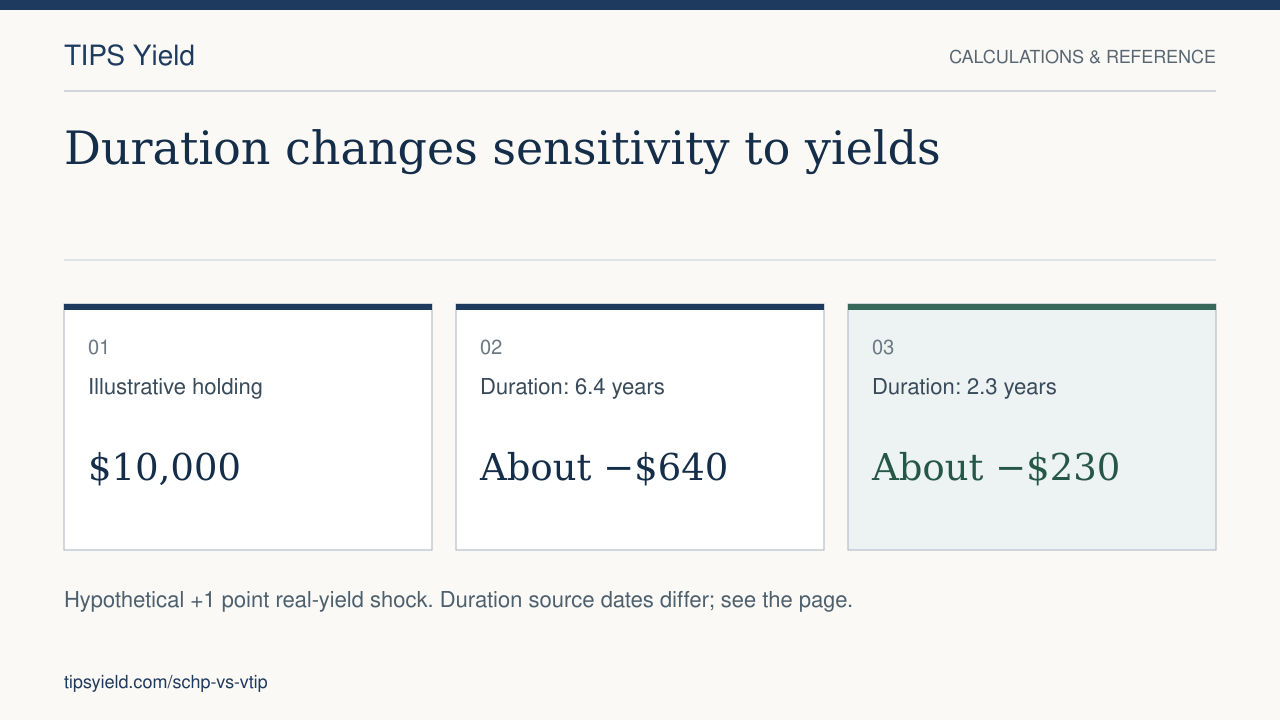
Use duration as a first-order sensitivity estimate, not a return forecast. For a hypothetical parallel one-percentage-point increase in real yields, duration alone suggests about a 6.4% price decline for the stated SCHP exposure and 2.3% for the stated VTIP exposure.
| Illustrative $10,000 holding | Price effect only | Value after that effect |
|---|---|---|
| 6.4-year duration | −$640 | $9,360 |
| 2.3-year duration | −$230 | $9,770 |
The calculation is price change ≈ −duration × yield change. It excludes convexity, coupon income, inflation accrual, fees and nonparallel curve changes. Actual total returns will differ. A decline in real yields reverses the direction of the estimated price effect.
Which exposure fits the question?
If the purpose is a broad TIPS allocation, the wider maturity coverage may be relevant. If the purpose is reducing sensitivity to real-yield changes, the shorter duration is relevant. Neither statement determines which holding will perform better over your particular period.
For money that must pay a bill on a known date, compare both funds with an individual maturity and a cash reserve. Even a short TIPS ETF can lose value before you need to sell it. Early-sale risk belongs in that decision.
What not to compare directly
Do not compare a trailing distribution yield with a Treasury real yield, or a market-price return with a NAV return without explaining the difference. Use identical measurement periods and consistent reinvestment assumptions for historical performance.
Distribution timing also matters for spending. VTIP's reviewed factsheet lists quarterly payments. Check each sponsor's current schedule and remember that the cash amount is variable.
A useful next step
Read the wider ETF comparison for other broad and short-maturity options. If your goal is matching annual retirement spending, work through the ladder example and tax cash-flow example before selecting investments.
How the cost and duration examples were computed
The annual fee illustration multiplies a constant $10,000 balance by the sponsor's stated expense ratio: 0.03% is $3 and 0.18% is $18. Actual fund expenses accrue within the fund and depend on asset values over time; this is a comparison convention.
The price-sensitivity illustration uses approximate price change = −duration × change in yield × starting value. For example, a one-percentage-point yield rise on a hypothetical $10,000 holding gives about −$640 at duration 6.4 and −$230 at duration 2.3. Convexity, fund trading, inflation accrual, distributions, fees and taxes are omitted. These figures are scenario calculations, not reported historical returns.
Inputs: Schwab's SCHP data (duration as of August 31, 2026) and Vanguard's VTIP factsheet (June 30, 2026). Both were reviewed September 11, 2026. The different observation dates are disclosed so this cannot be mistaken for a synchronized market snapshot.