Browse the reference library
The 10-year TIPS real yield and breakeven inflation rate, every trading day since 2003
Reference yield observed . Source: Treasury / FRED. See chart for historical observation dates.
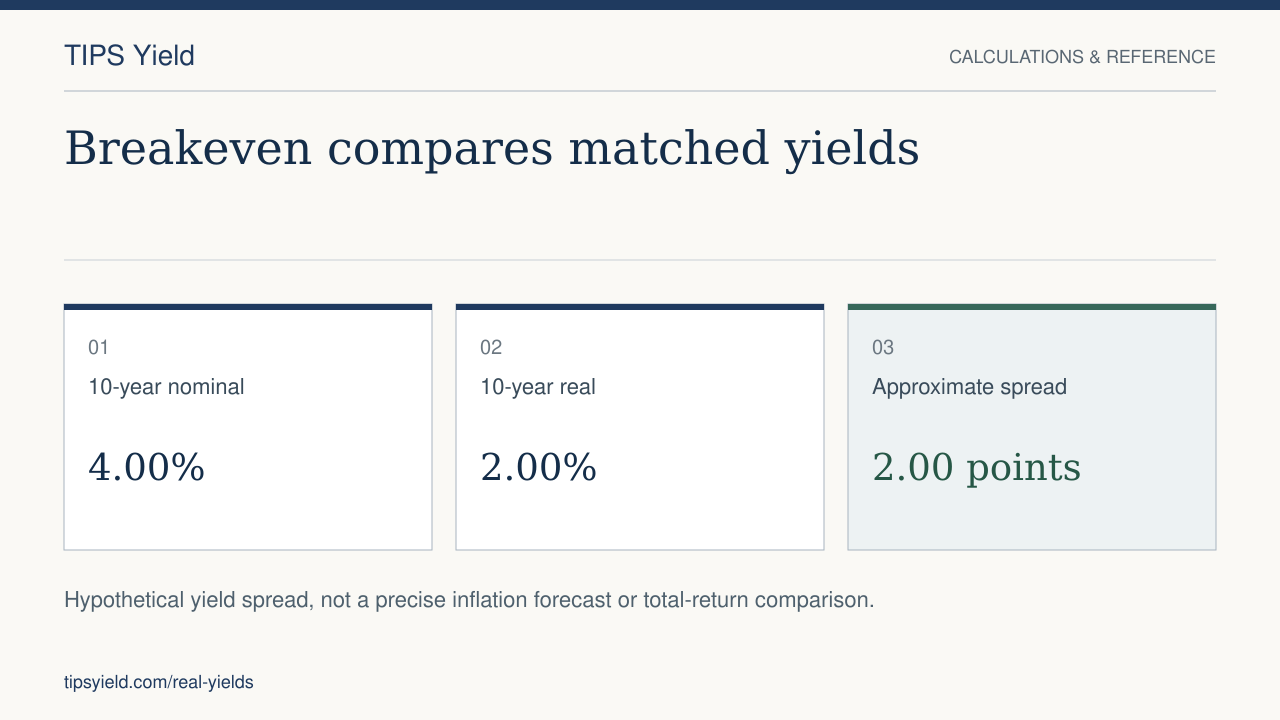
Compare the Treasury 10-year real par yield with 10-year breakeven inflation. Breakeven is the nominal yield minus the real yield on a matched date; it includes risk and liquidity effects and is not a precise inflation forecast.
Loading interactive history. Recent observations are available in the table below.
Last ten trading days (table)
| Date | Real yield | Breakeven | Implied nominal |
|---|
How to read this chart
A TIPS real yield summarizes the price of its inflation-adjusted cash flows. Its stated coupon is a different number. Holding a bond to maturity avoids having to sell at an uncertain market price, but taxes, fees, coupon reinvestment and the timing of spending affect your outcome. A ten-year reference yield cannot price every rung of a thirty-year ladder.
Nominal yield minus real yield is a useful approximate breakeven, not an exact comparison of two coupon bonds. The TIPS versus Treasuries example shows the assumptions behind a simplified inflation comparison.
What does today's yield mean for a ladder?
The saved real-yield observation is shown above. Higher assumed real yields generally reduce the cost of a fixed real-spending plan. Use the same $40,000 spending plan at 1%, 2% and 3% to see the effect without confusing it with a market forecast.
Sources, dates and calculation method
The interactive service uses saved FRED history and appends Treasury par yield observations when available. It attempts a refresh at most once every six hours. Markets, publication lags and source outages can leave the last observation unchanged. The dated table below is included in the page even when the chart service is unavailable.
The percentile is the share of available daily real-yield observations strictly below the latest observation, rounded to a whole percent. It describes this dataset; it does not predict future yields or returns. Missing trading days are not filled with invented values.
Source series: FRED DFII5, DFII10, DFII30 and T10YIE; newer observations use Treasury real and nominal par curves. Values are annual percentage rates, not percentage-point changes or total returns.
The 5-year and 30-year real yields have their own daily charts. Sizing a ladder at today's yields takes thirty seconds in the calculator, and the primer covers when to prefer funds, the tax mechanics, and the auction calendar in depth.
Recent Treasury observations
Saved observations through . The interactive history may contain newer observations.
| Date | 5y real | 10y real | 30y real | 10y nominal | 10y breakeven |
|---|---|---|---|---|---|
| 2026-09-18 | 2.55% | 2.68% | 3.09% | 5.01% | 2.33% |
| 2026-09-17 | 2.46% | 2.61% | 3.04% | 4.94% | 2.33% |
| 2026-09-16 | 2.51% | 2.68% | 3.09% | 5.01% | 2.33% |
| 2026-09-15 | 2.42% | 2.62% | 3.07% | 5.00% | 2.38% |
| 2026-09-14 | 2.40% | 2.60% | 3.05% | 4.97% | 2.37% |
| 2026-09-11 | 2.38% | 2.60% | 3.07% | 4.96% | 2.36% |
| 2026-09-10 | 2.29% | 2.55% | 3.05% | 4.95% | 2.40% |
| 2026-09-09 | 2.20% | 2.46% | 2.98% | 4.83% | 2.37% |
| 2026-09-08 | 2.17% | 2.43% | 2.96% | 4.80% | 2.37% |
| 2026-09-04 | 2.17% | 2.43% | 2.96% | 4.78% | 2.35% |
Source: U.S. Treasury par yield curves. Breakeven = nominal minus real on the same date. Download recent CSV · Download available full history. Historical coverage depends on the saved history service.
THE PRACTICAL NEXT STEP
What comes with the TIPS guide?
Buying walkthroughs, tax examples, and a formulas-visible workbook for planning your ladder.
62-page PDF + Excel workbook · One-time purchase