TIPS ETFs compared
The useful first choice is which part of the TIPS market you want to hold. Broad funds and short-maturity funds have different interest-rate exposure even when their fees look similar. There is no single best fund for every spending horizon.
Four funds and their published fees
| Fund | Exposure | Expense ratio | Primary source |
|---|---|---|---|
| SCHP | Broad U.S. TIPS market | 0.03% | Schwab fund page |
| VTIP | TIPS with less than five years remaining | 0.03% | Vanguard factsheet, June 30, 2026 |
| TIP | Broad U.S. TIPS exposure | 0.18% | iShares TIP |
| STIP | TIPS with under five years remaining | 0.03% | iShares STIP |
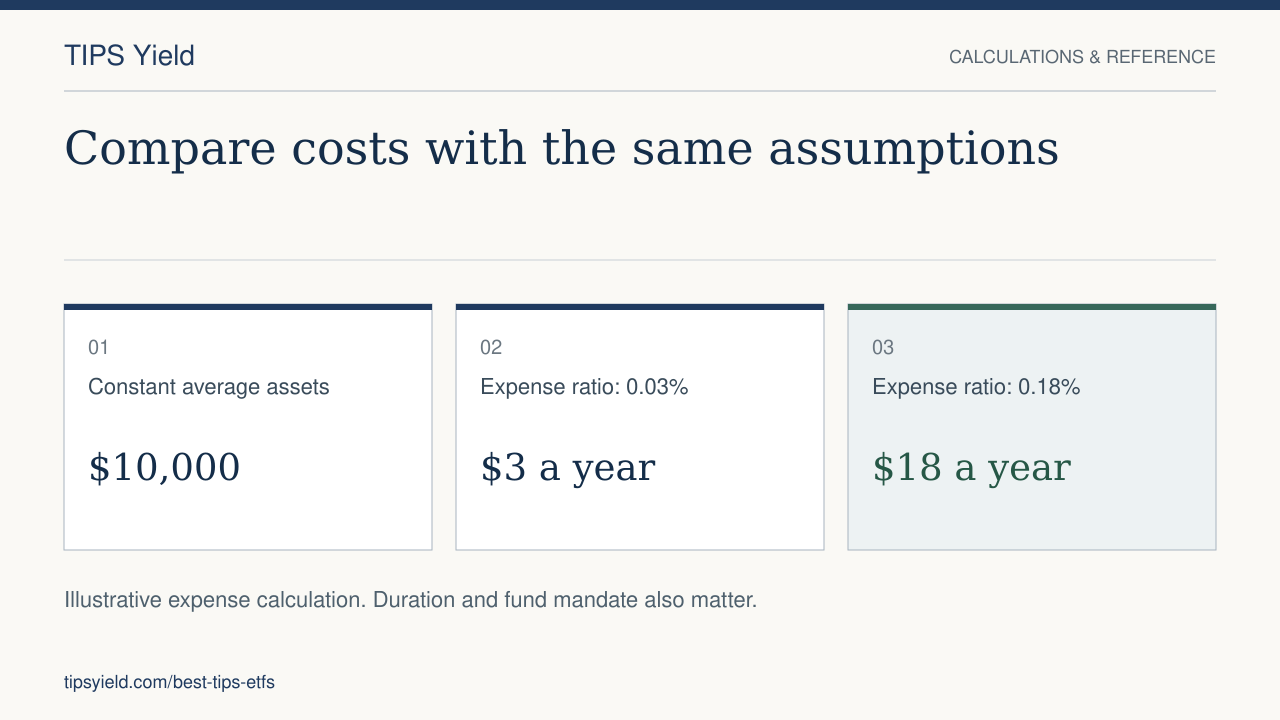
The list is a comparison of common broad and short-maturity choices, not an exhaustive market ranking. A 0.03% annual expense ratio corresponds to about $3 per $10,000 of constant average assets; 0.18% corresponds to about $18. Trading spreads, tracking differences and the fund's mandate also matter.
Duration is the larger economic choice
Schwab reports effective duration of 6.4 years for SCHP as of August 31, 2026. Vanguard's June 30, 2026 factsheet reports 2.3 years for VTIP. These are dated observations, not a perfectly synchronized comparison.
Duration estimates sensitivity to yield changes. A longer-duration fund generally moves more for a given real-yield change. That may help when yields fall and hurt when yields rise. Shorter duration is not the same as a stable principal guarantee.
For a worked comparison, see SCHP versus VTIP. Compare any specialized long-duration fund's current mandate and risk separately; it is not interchangeable with the short end of the market.
Read yield labels carefully
SEC yield, trailing distribution yield and portfolio yield to maturity measure different things. Inflation accruals can make displayed TIPS-fund yields volatile. Read the sponsor's definition and date, including whether a quoted portfolio yield includes an inflation assumption, before comparing it with a Treasury real-yield series.
Do not describe a fund's portfolio yield as a promised return on your shares. Fees, portfolio changes, reinvestment and the eventual sale price affect your result.
Distributions and taxes
Distribution schedules vary. VTIP's reviewed factsheet specifies quarterly distributions; do not assume every TIPS ETF pays monthly. Amounts can vary with portfolio income and inflation adjustments.
Use sponsor tax supplements for the share of income attributable to government obligations, and check state rules. Fund distributions do not automatically share every tax characteristic of direct Treasury holdings. See the tax reference.
When a fund solves a different problem
The conventional rolling funds compared here are designed for ongoing exposure. They do not promise an inflation-adjusted payment on your chosen retirement-spending date. Individual maturities and defined-maturity products have different structures; see funds versus individual TIPS.
Choose a comparison based on the job: broad inflation-linked bond exposure, less duration sensitivity, or a plan for dated cash flows. For the last task, begin with the ladder walkthrough and calculator.
How the cost and duration examples were computed
The annual fee illustration multiplies a constant $10,000 balance by the sponsor's stated expense ratio: 0.03% is $3 and 0.18% is $18. Actual fund expenses accrue within the fund and depend on asset values over time; this is a comparison convention.
The price-sensitivity illustration uses approximate price change = −duration × change in yield × starting value. For example, a one-percentage-point yield rise on a hypothetical $10,000 holding gives about −$640 at duration 6.4 and −$230 at duration 2.3. Convexity, fund trading, inflation accrual, distributions, fees and taxes are omitted. These figures are scenario calculations, not reported historical returns.
Inputs: Schwab's SCHP data (duration as of August 31, 2026) and Vanguard's VTIP factsheet (June 30, 2026). Both were reviewed September 11, 2026. The different observation dates are disclosed so this cannot be mistaken for a synchronized market snapshot.