TIPS ladder gap years
A spending year in a calculator does not guarantee there is an outstanding bond maturing that year. The current calculator flags 2037, 2038 and 2039 as hypothetical rungs. Before placing orders, compare your plan with the dated Treasury maturity inventory.
Why a gap exists
Issuance history and the terms Treasury offers determine which maturity dates exist. New ten-year issues gradually extend the nearer part of the calendar, while older longer-dated issues cover later years. A missing year is a security-availability problem, not a missing cell to fill with a made-up quote.
Under the current issuance pattern, ten-year issues in 2027–2029 would provide maturities in 2037–2039. That is an expectation based on the pattern, not a guarantee of future issuance or yield. Use actual Treasury announcements when they become available.
Why 2037 to 2039 in particular
The gap is a leftover of how Treasury's TIPS programs started and stopped. Treasury's auction records back to 1997 show the pattern:
| Program | Original issues | Maturities produced |
|---|---|---|
| Early 30-year TIPS | 1998, 1999 and 2001 | 2028, 2029 and 2032 |
| 20-year TIPS | 2004 to 2009 | 2025 to 2029 |
| 30-year TIPS, current program | Every February since 2010 | 2040 to 2056 |
| 10-year TIPS | Every year since 1997, in January and July since 2004 | Up to July 2036 so far |
Source: TreasuryDirect auction records, also available as a download from the auction results page.
The 20-year program ended before it reached past 2029. The 30-year program restarted in February 2010, so its first maturity is 2040. No bond from any program has an original term ending in 2037, 2038 or 2039. The 10-year program is now three calendar years away from reaching them.
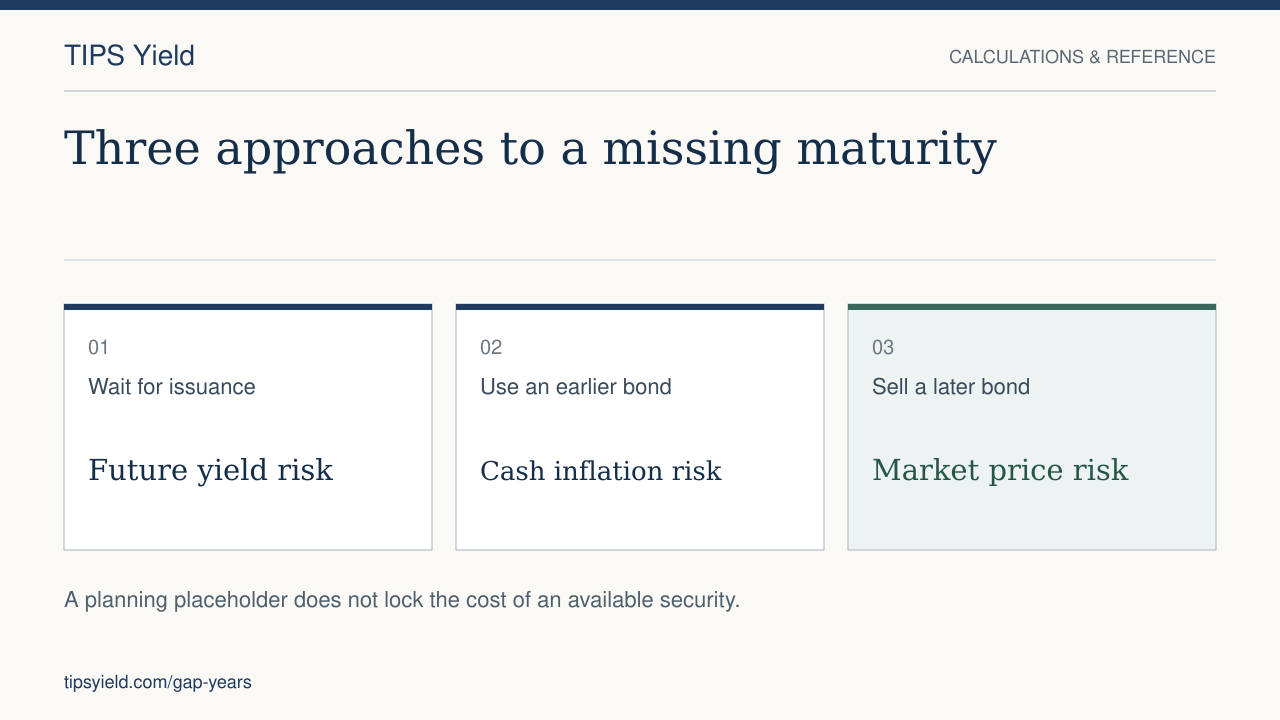
Three ways to plan for a missing year
| Approach | Cash-flow mechanism | Uncertainty that remains |
|---|---|---|
| Reserve for future purchases | Hold earmarked funds and purchase a suitable security if issued later | Future real yield, available issue terms and return on the reserve |
| Earlier maturity plus a cash bridge | Receive principal before the spending year, then hold or reinvest it until needed | Inflation and reinvestment rates during the bridge period |
| Later bond with planned sale | Sell some of a later-maturing holding in the spending year | Market price, spread and taxes at the time of sale |
A $40,000 gap-year example
Suppose the plan needs $40,000 in today's purchasing power during 2038. A 2036 maturity pays before that need; its proceeds must bridge the intervening period. A 2040 maturity pays after the need; it cannot directly fund the earlier bill without a sale or another funding source.
For a simplified two-year cash bridge, $40,000 of purchasing power would require $42,436 of nominal cash if inflation were 3% annually: $40,000 × 1.03². This hypothetical illustration ignores the return earned on the reserve and taxes. If both nominal cash returns and inflation differ from the assumptions, the funding result changes.
For the later-bond approach, an unchanged face amount does not imply a known 2038 sale value. Read the early-sale example before treating that route as equivalent to holding a matching maturity.
The bonds on each side of the gap
In the October 6, 2026 Treasury snapshot, the nearest outstanding maturities are:
| Maturity | Coupon | Original term | Distance from the gap |
|---|---|---|---|
| January 15, 2036 | 1.875% | 10-year | Pays one year before January 2037 |
| July 15, 2036 | 2.375% | 10-year | Pays six months before January 2037 |
| February 15, 2040 | 2.125% | 30-year | Pays about 13 months after December 2039 |
CUSIPs and the full list are in the maturity schedule. The July 2036 bond is the newest 10-year TIPS, and Treasury is still reopening it during 2026.
Some investors combine the second and third approaches by splitting a gap year's money between both sides. For a need in mid-2038, the July 2036 bond matures about two years early and the February 2040 bond about 1.6 years late. Weighting by those distances puts roughly 44% in the 2036 bond and 56% in the 2040 bond, so the average maturity lands near mid-2038. The 2036 share still needs a cash bridge. The 2040 share still needs a sale at an unknown price. The split balances the two risks. It does not remove them.
When the gap years should fill
Treasury sells new 10-year TIPS in January and July and reopens them twice each, according to TreasuryDirect. If that schedule continues, the gap closes one maturity at a time:
| Expected new 10-year issue | Expected reopenings | Maturity it would create |
|---|---|---|
| January 2027 | March and May 2027 | January 15, 2037 |
| July 2027 | September and November 2027 | July 15, 2037 |
| January 2028 | March and May 2028 | January 15, 2038 |
| July 2028 | September and November 2028 | July 15, 2038 |
| January 2029 | March and May 2029 | January 15, 2039 |
| July 2029 | September and November 2029 | July 15, 2039 |
These dates are projections from the current pattern, not Treasury announcements. Check the auction calendar as each one approaches.
What waiting has meant in practice
The reserve approach accepts whatever real yield the future auction sets. Recent 10-year original-issue auctions show how wide that range has been:
| Auction month | Maturity | High real yield |
|---|---|---|
| January 2021 | January 2031 | −0.987% |
| July 2021 | July 2031 | −1.016% |
| January 2022 | January 2032 | −0.540% |
| July 2022 | July 2032 | 0.630% |
| January 2023 | January 2033 | 1.220% |
| July 2023 | July 2033 | 1.495% |
| January 2024 | January 2034 | 1.810% |
| July 2024 | July 2034 | 1.883% |
| January 2025 | January 2035 | 2.243% |
| July 2025 | July 2035 | 1.985% |
| January 2026 | January 2036 | 1.940% |
| July 2026 | July 2036 | 2.438% |
Source: TreasuryDirect auction records.
Over these six years, the yield at the same auction slot ranged from −1.016% to 2.438%, a spread of more than 3.4 points. Someone holding cash for a future 10-year bond in 2021 would have paid more for the same real income than someone buying in 2026. The reverse could happen next. The cost of a gap year bought later is unknown until the auction.
For scale, $40,000 of 2038 spending discounted 12 years from 2026 costs about $35,500 at a 1% real yield and about $28,100 at 3%. That is a difference of roughly $7,400 for a single gap year.
How the calculator treats these years
The estimate includes a cost for each gap-year target, using the same interpolated reference-yield and par-purchase assumptions as other rows. It flags the row so it is not confused with an available bond. It does not execute any of the three strategies above or lock a future purchase yield.
See the methodology. A plan with a funded numerical placeholder still needs a real funding decision.
Document the choice
For each gap year, record the spending target, designated reserve or holding, expected cash dates, assumed return and inflation, and the event that triggers a review. Revisit availability after relevant auctions and whenever the spending need changes.
The guide’s Gap Years worksheet keeps these records for each year. Start with the cash-flow walkthrough if you have not yet sized the rest of the ladder.
Frequently asked questions
Why are there no TIPS maturing in 2037, 2038 or 2039?
No TIPS program has issued a bond with a term ending in those years. The 20-year program stopped at a 2029 maturity, the 30-year program restarted with a 2040 maturity, and the newest 10-year TIPS matures in July 2036.
When will TIPS maturing in 2037 be available?
If Treasury keeps its current schedule, the 10-year TIPS issued in January 2027 would mature in January 2037, and the July 2027 issue would mature in July 2037. Treasury announces each auction shortly before it is held.
What is the best way to fill a TIPS ladder gap year?
There is no risk-free method. Holding a reserve for future 10-year auctions leaves the future yield unknown. Using the 2036 maturity leaves the bridge period's inflation and returns unknown. Using the 2040 maturity leaves the sale price unknown. Many investors split between both sides.
Does the calculator include gap years in the cost?
Yes. It prices each gap year with the same interpolated yield as other years and flags the row. The estimate is a placeholder, not a bond you can buy today.
How much does one gap year cost?
For $40,000 of 2038 spending, about $35,500 at a 1% real yield and about $28,100 at 3%, discounted 12 years from 2026. The actual cost depends on the yield when you buy.