Should You Buy TIPS Now? What Today's Real Yields Mean
Whether to buy TIPS now depends on the real yield you would lock in, your view of inflation, how you hold them, and which account they sit in. This page sets out the data as of September 28, 2026 and the trade-offs. It is general information, not a recommendation to buy or avoid TIPS.
What the decision depends on
Four questions shape the answer.
- How does today's real yield compare with history?
- How does the breakeven inflation rate compare with your own view?
- Will you hold to maturity or own a fund?
- Is the account taxable or tax-advantaged?
Real yields on September 28, 2026
| Measure | September 28, 2026 |
|---|---|
| 5-year real yield | 2.73% |
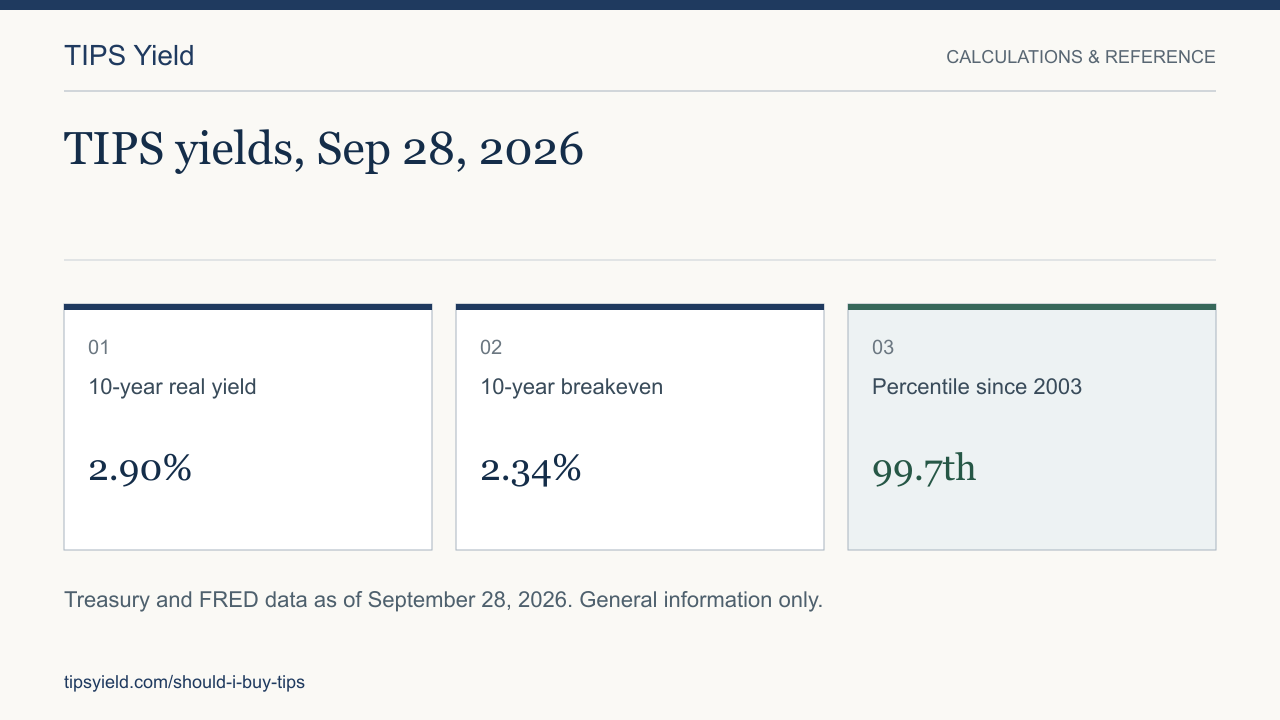
| 10-year real yield | 2.90% |
| 30-year real yield | 3.28% |
| 10-year nominal Treasury yield | 5.24% |
| 10-year breakeven inflation | 2.34% |
| 10-year breakeven average since 2003 | 2.11% |
Sources: Treasury daily par real yield curve and FRED series DFII10 for history, checked September 29, 2026. Data as of September 28, 2026.
How today's 10-year real yield compares with history
The 10-year real yield of 2.90% is the highest daily close since November 24, 2008, when it was 3.11%. The daily peak since 2003 was 3.15% on November 21, 2008. Only 18 trading days since January 2003 closed at 2.90% or higher. It sits at the 99.7th percentile of daily readings since January 2, 2003.
For contrast, the low was negative 1.19% on August 3, 2021. The 10-year real yield was below zero on 955 trading days between August 2011 and April 2022. A high level relative to history says where yields are. It does not say where they go next. See the 10-year real yield history chart.
What the breakeven means
Breakeven inflation is the nominal 10-year yield minus the 10-year real yield. Here that is 5.24% minus 2.90%, or 2.34%. As an illustration, a 10-year TIPS held to maturity would beat a 10-year nominal Treasury if CPI-U inflation averages above about 2.34% over those ten years, before taxes. If inflation averages less, the nominal Treasury would come out ahead.
The breakeven today is above its 2.11% average since 2003. Compare it with your own view of inflation. The figure is a reference point, not a forecast. The TIPS versus Treasuries page walks through the comparison.
Holding to maturity versus a fund
An individual TIPS held to maturity pays back principal, adjusted for inflation, on a known date. A fund has no such date unless it is a term fund. Fund prices move with real yields, and a fund can lose value when yields rise. The funds versus individual TIPS page covers the difference. Term funds are covered in TIPS ladder ETFs.
Risks to weigh
- Real yields can rise further. A TIPS bought today falls in price if real yields rise and you sell early. See selling TIPS before maturity.
- Phantom income. In a taxable account, the inflation adjustment to principal is taxed each year even though you receive it only at maturity or sale. See phantom income. Tax-advantaged accounts work differently, so check with a tax professional and the IRS.
- The deflation floor is limited. Treasury pays at least the original principal at maturity, so the floor applies to principal at maturity only. It does not protect the price if you sell early.
- Timing. No one can time the peak in real yields. A yield that looks high today can go higher.
Neutral steps to take
- List the dates when you need to spend money and the amounts.
- Run those dates through the ladder calculator to see the estimated cost at current yields.
- Review the real yield history to see how today compares.
- Decide whether you would hold to maturity, then read how to buy TIPS.
Again, this page is general information, not a recommendation. Your situation, taxes, and goals differ from any example here.
How the figures were computed
Breakeven equals the 10-year nominal yield minus the 10-year real yield: 5.24% − 2.90% = 2.34%. The 2.11% average is the mean of daily 10-year breakevens since 2003. The percentile ranks the September 28, 2026 close among daily readings since January 2, 2003. The breakeven comparison ignores taxes, fees, and the timing of inflation. Yield data come from the Treasury daily par real yield curve, with FRED history before the site's own feed, as of September 28, 2026.