The Fed raised rates 25 basis points. What it means for TIPS
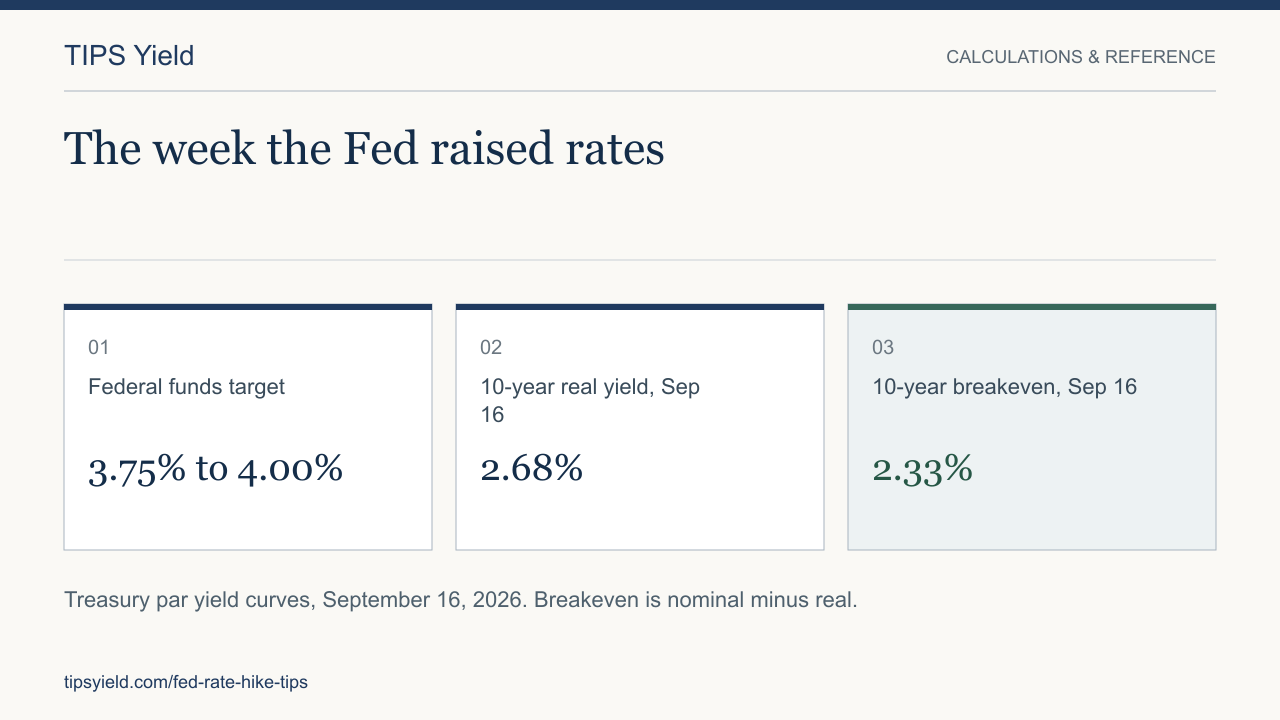
On September 16, 2026 the Federal Open Market Committee raised the target range for the federal funds rate by a quarter point to 3.75% to 4.00%. The vote was 12 to 0. It was the first increase since July 2023. The statement said inflation remains elevated and that the move "will support a timelier return to the Committee's 2 percent goal."
The federal funds rate is a nominal overnight rate. TIPS pay a fixed real yield plus an inflation adjustment to principal. No formula links the two. The connection runs through market prices. This page covers what the decision changed, what it did not change, and how to read the numbers if you hold TIPS or plan to buy them.
What the Fed decided
| Item | September 2026 | June 2026 |
|---|---|---|
| Federal funds target range | 3.75% to 4.00% | 3.50% to 3.75% |
| Vote | 12 to 0 | |
| Projected funds rate, end of 2026 | 4.1% | 3.8% |
| Projected funds rate, end of 2027 | 4.1% | 3.6% |
| Projected funds rate, end of 2028 | 3.9% | 3.4% |
| Projected funds rate, longer run | 3.2% | 3.1% |
| PCE inflation, 2026 | 3.7% | 3.6% |
| PCE inflation, 2027 | 2.3% | 2.3% |
| Core PCE inflation, 2026 | 3.4% | 3.3% |
| Unemployment rate, 2026 | 4.1% | 4.3% |
The projections matter as much as the quarter point. In June the median participant expected the funds rate to fall to 3.6% by the end of 2027. In September the median is 4.1% for both 2026 and 2027. That is a change of half a point in the expected path, on top of the increase itself. The Committee also said it is continuing to maintain ample reserves in the banking system, so the balance sheet did not change.
How the yield curve moved
Treasury publishes par yield curves each business day. The table shows the week before the meeting, the two meeting days, and the day after.
| Date | 5-year real | 10-year real | 30-year real | 10-year nominal | 10-year breakeven |
|---|---|---|---|---|---|
| September 10 | 2.29 | 2.55 | 3.05 | 4.95 | 2.40 |
| September 15 | 2.42 | 2.62 | 3.07 | 5.00 | 2.38 |
| September 16 | 2.51 | 2.68 | 3.09 | 5.01 | 2.33 |
| September 17 | 2.46 | 2.61 | 3.04 | 4.94 | 2.33 |
Three things stand out. Real yields rose across the curve, with the largest move at five years. Nominal yields rose less than real yields, so the 10-year breakeven fell from 2.40% to 2.33%. And the day after the decision gave part of the move back.
Breakeven is the nominal yield minus the real yield at the same maturity. A falling breakeven means the market trimmed the inflation compensation it demands. That is the usual pattern when the Fed tightens. Investors expect lower future inflation, so they accept a lower nominal yield for a given real yield. The Fed does not set real yields, but its expected path is a large part of what the market prices into them. The TIPS versus Treasuries page explains what breakeven does and does not tell you.
What changes for a TIPS you already own
Three separate things, and only one of them moved this week.
The inflation accrual did not change. Principal follows CPI-U with a lag of two to three months. The reference CPI for every day in October 2026 is already fixed by the August CPI print of 334.980. Nothing the Fed did on September 16 alters the accrual until the inflation data itself responds, and that takes months.
The coupon did not change. A TIPS coupon is fixed at the original auction. The 10-year TIPS of July 2036 pays 2.375% on adjusted principal for the life of the bond.
The market price did change. When real yields rise, existing TIPS fall in price. A 10-year TIPS has a duration near 8.5 years. The 13 basis point rise in the 10-year real yield between September 10 and September 16 implies a price drop of roughly 1.1%. The 30-year real yield moved only 4 basis points, but with a duration near 21 years that still implies a drop of about 0.8%. These are first-order estimates. The page on selling before maturity works through the arithmetic.
If you hold to maturity, the price move is a paper figure. You receive the inflation-adjusted principal and the coupons no matter what the Fed does in between.
What changes for a new purchase
A buyer today gets a higher real yield than a buyer last week. The 10-year TIPS reopening on September 17, the day after the decision, cleared at a real yield of 2.653%. That is the highest result for a 10-year TIPS auction since October 2008. The bid-to-cover ratio was 2.24, the lowest in a year, so demand was thinner even as the yield rose.
For a ladder, a higher real yield means the same income costs less. The calculator's default plan buys $40,000 a year of real income from 2027 through 2046. The table runs that plan through the Treasury par curves above.
| Curve date | 5, 10 and 30-year real yields | Model cost | Weighted real yield |
|---|---|---|---|
| September 10 | 2.29 / 2.55 / 3.05 | $615,718 | 2.55% |
| September 16 | 2.51 / 2.68 / 3.09 | $608,804 | 2.70% |
| September 17 | 2.46 / 2.61 / 3.04 | $612,405 | 2.64% |
| Flat 2.00% for comparison | 2.00 / 2.00 / 2.00 | $654,057 | 2.00% |
The decision-day curve bought the same 20 years of income for about $6,900 less than the curve a week earlier, a saving of 1.1%. That is a modest change next to where yields stood in January, when the 10-year auction cleared at 1.94%. The model uses par bonds and ignores taxes, accrued interest and the missing maturity years. Run your own figures on the ladder calculator.
Real yields against the projected policy rate
One way to judge a 2.6% real yield on a 10-year TIPS is to set it against what the Fed itself projects. The September median puts the funds rate at 4.1% at the end of 2027 and PCE inflation at 2.3% for that year. That implies a real overnight rate near 1.8%. The longer-run median funds rate is 3.2% against a 2% inflation goal, a real rate of about 1.2%. A 10-year TIPS at 2.6% sits above both.
Term premium, the extra yield for holding a long bond instead of rolling short ones, explains part of the gap. Projections also change, as this week showed. Still, a buyer locking in 2.6% real for ten years is being paid more than the Fed expects its own policy rate to deliver in real terms.
Funds react faster than individual bonds
A TIPS fund marks to market every day, so the week's price drop appeared in fund values at once. Longer-duration funds such as SCHP and TIP moved more than short-duration funds such as VTIP and STIP. A fund never matures, so there is no date on which the paper loss stops mattering. The funds versus individual bonds page covers that difference. A fund does reinvest maturing bonds and coupons at the new higher yields, which raises its future income.
What to watch
- The September CPI print, due in mid-October, sets the reference CPI for December. The CPI updates page tracks each print.
- The next FOMC meeting is October 27 and 28. After the decision, futures markets leaned toward one more quarter-point increase before the end of 2026.
- The next TIPS auction is a new 5-year issue on October 22, 2026, announced October 15. The auction calendar updates when Treasury posts the terms.
- The 10-year breakeven. If it keeps falling while real yields hold, the market is reading the Fed as credible on inflation, and nominal Treasuries gain at the margin. If real yields fall back, this week's buyers got the better entry.
Sources
FOMC statement, September 16, 2026 · Summary of Economic Projections, September 2026 · Treasury daily real yield curve · Treasury daily nominal yield curve · TreasuryDirect auction results · Treasury tentative auction schedule (PDF)